“Earth's tropical belt is expanding much faster
than expected, and that could bring more storms to the
temperate zone and drier weather to parts of the world
that are already dry, climate scientists reported on
Sunday.
“Remarkably, the tropics appear to have already
expanded -- during only the last few decades of the
20th century -- by at least the same margin as models
predict for this century," the scientists said
in the current edition of Nature Geoscience.”
—
“Tropical temperatures are warm, and it rains
a lot, with little seasonal or day-to-day change. The
subtropics, by contrast, are generally dry. If the warm,
wet tropical climate is spreading poleward, the dry
subtropic climate may head for the poles too.
“Those dry subtropical bands could include some
of the most heavily populated places on Earth, the scientists
said: the Mediterranean, the US Southwest, northern
Mexico, southern Australia, southern Africa and parts
of South America.”
—
“Those storm tracks are linked with the position
of the jet stream, which is one way we use to delineate
the width of the tropics," Seidel said by telephone
from NOAA's Air Resources Laboratory outside Washington.
"The jet streams are moving poleward, and so, presumably,
would the storm tracks.”

And from the recent past:
“A thought came to me, when I was reading in
the papers about the scandals of the regional government:
scientists say the palm tree line, that is the climate
favorable to the palm tree form of vegetation, is creeping
northward at the rate, I think, of five hundred meters
every year . It's rising like mercury in a thermometer.”
Sciascia, 1961.
water pressure in the western
usa, and shrinking glaciers
“One of the United States' most beautiful landmarks
may soon have to change its name. Glacier National Park
in Montana, which once boasted 150 of the spectacular
rivers of ice, is now down to 25, and the most recent
data show that the remainder "may be gone in our
lifetimes," an ecologist said here yesterday at
a meeting of the American Geophysical Union. Other than
the aesthetic loss, the disappearance of glaciers across
the American West could cause huge problems for a regional
population that is 85% dependent on mountain water and
already coping with shortages.”
—
“ [...] The latest surveys conducted by the organization
show that the glaciers are, on average, 1.7 meters thinner
each year--a decline much more rapid than expected [...]
”
—
“ [...] Also contributing is carbon black, known
more commonly as soot, which continually rains down
on the glaciers but tends to concentrate on the surface
of the ice. By the calculations of his research team,
Painter said, soot increases heat absorption from the
sun's rays by 43%. That provides "yet another reason"
to limit carbon black from industrial emissions, [...]
” [Quoted from sciencenow.sciencemag.org]
“Since 1950, the Sierra snowpack has decreased
by about 20 percent, the temperature in the Rocky Mountains
has gone up 3 degrees and spring water flow in the Columbia
River has decreased significantly.
“ "These signals are the same no matter
where you go in the West," marine physicist Tim
Barnett of Scripps Institution of Oceanography said
Tuesday at the annual meeting of the American Geophysical
Union in San Francisco. "We've got a real serious
problem."
“By scaling down global climate models to bring
greater detail of the region, a team of scientists led
by Barnett and atmospheric scientist Ben Santer of Lawrence
Livermore National Laboratory projected these trends
into the future and found a grim picture for the West.
By about 2040, the Colorado Rockies will be nearly barren
of snow as early as April 1 each year. And a similar
story will play out in the Sierra.” [Quoted from mercurynews.com]
“ "About 50 percent of the fresh water
consumed by people worldwide comes from mountains, so
the rate at which snowpack is disappearing is worrying,
said Daniel Fagre, an ecologist who works for the US
Geological Survey in Glacier National Park in Montana.
“Fagre said only about 25 of 150 glaciers that
once dotted Glacier National Park remain. Initial data
projected that, for the first time in more than 1,000
years, the park would be without ice floes by 2030,
but more recent estimates project the icebergs may be
lost even before then, Fagre said.
“ "The glaciers of Glacier National Park
will be gone in our lifetimes," Fagre said, [...]
” [Quoted from planetark.org]
and in iceland:
“ "It's nice to have plants around, but
well, it's not good. It gets better in Iceland, but
the rest of the world sees the bad part," she says.
“Once the measuring tape is rolled up, Jonsson
heads back to his truck. He checks a clipboard to figure
out exactly how far the glacier has retreated: 41 meters,
the largest retreat he has ever seen. That's almost
half the length of a football field in a single year.
This isn't happy news for Solveig Thorvaldsdottir.
“ "I mean, what are we going to call our
country when the ice all melts? We might as well call
it lava land," she says.” [Quoted from npr.org]
and in china:
“High altitude glaciers in China's remote west
have shrunk by up to 18 percent over the last five years
due to global warming, state media said on Friday, citing
preliminary results from an on-going survey.”
—
"Global warming has led to an increase in the average
temperature in the western area of China over the past
few decades. This has caused the glacial shrinking,
a thawing of frozen earth and worsening arid conditions,[...]
” [Quoted from planetark.org]
Reference
glaciers, for more detailed information.
“Scientist Ian Joughin says that in the past
few years, Jakobshavn's speed has doubled.
“ "That's putting about twice as much ice
into the fjord as a decade ago ... and twice as much
into the ocean," he says.”
—
“The station has to be re-anchored into the ice
because Greenland's entire ice sheet is moving. Joughin,
from the University of Washington, pulls out his GPS
unit and finds that the region has slid more than 100
yards closer to the ocean during the past year.
“He also measures a length of fishing line he
had sunk straight down into the ice the previous summer
to see how much of the ice has melted away. A lot of
the line he had buried is lying on the surface.
“ "Wow," he says. "It's a meter
and a half of melt since last year. … Almost five
feet."
“Greenland's ice sheet deforms constantly, like
pancake batter flowing on a griddle. Each year, more
snow piles up in the middle, and each year, more ice
slides off into the sea or melts away. At the moment,
Greenland's melt water increases global sea level by
about a quarter of an inch per decade. If that melt
increases as the world warms, a melting Greenland will
eventually eat away the shorelines of the world.”
“These new data come from the NASA/German Aerospace
Center's Gravity Recovery and Climate Experiment (Grace).
Launched in March 2002, the twin Grace satellites circle
the globe using gravity to map changes in Earth's mass
500 kilometers (310 miles) below. They are providing
a unique way to monitor and understand Earth's great
ice sheets and glaciers. [“The continent of Antarctica
has been losing more than 100 cubic kilometers (24 cubic
miles) of ice per year since 2002.” Quoted from nasa.gov]
“Grace measurements have revealed that in just
four years, from 2002 to 2006, Greenland lost between
150 and 250 cubic kilometers (36 to 60 cubic miles)
of ice per year. One cubic kilometer is equal to about
264 billion gallons of water. That's enough melting
ice to account for an increase in global sea level of
as much as 0.5 millimeters (0.019 inches) per year,
according to Isabella Velicogna and John Wahr of the
University of Colorado, Boulder. They published their
results in the scientific journal Nature last fall.
Since global sea level has risen an average of three
millimeters (0.1 inch) per year since 1993, Greenland's
rapidly increasing contribution can't be overlooked.”
varying
weather systems
There are various recognised local weather systems which
occillate over fairly regular cycles. These are sometimes
loosely referred to as interdecadally varying systems.
north atlantic
oscillation

Winter North Atlantic Ocillation
index. Image: Tim
Osbourn, cru.uea.ac.uk
“The North Atlantic Oscillation (NAO) is one
of the major modes of variability of the Northern Hemisphere
atmosphere. It is particularly important in winter,
when it exerts a strong control on the climate of the
Northern Hemisphere. It is also the season that exhibits
the strongest interdecadal variability.”
The chart above shows the differences between the normalised
sea level pressure over Gibraltar and the normalised sea
level pressure over Southwest Iceland. That is, it is
the Gibraltar minus Iceland version of the NAO index.
It is a useful index of NAO strength during winter (December
to March). The black line is the trend.
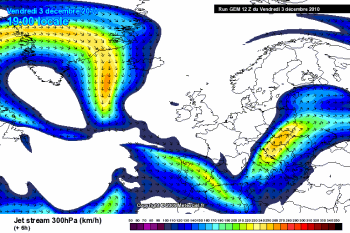
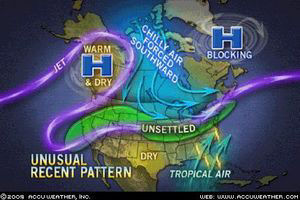
changes
in the northern hemisphere, 2010
Notice that the jet stream, which commonly goes across
Britain and the Netherlands, has now been forced southward
and is even showing breaks. The jet stream tends to push
the atmosphere around, and northern winters are currently
unusually cold. Meanwhile, the Arctic regions are warming
more quickly than most of the planet. If the general (average)
temperature of the planet rises, this means that the energy
in the weather system is higher and, therefore, is liable
to greater instabilities.
You can watch this effect as you steadily boil a saucepan
of water; as the (average) temperature rises, so the water
will show increasing agitation. You cannot predict the
rapid changes in the roiling water, but you can measure
an average temperature and observe the effect of the increasing
energy. Do not confuse planetary warming with local weather
systems.
El
Niño and La Niña
These two current/wind systems are local factors in affecting
weather.
El Niño is a temporary change in the equatorial
Pacific Ocean’s climate, off Peru and Ecuador, during
winter months. Usually, the east-to-west surface wind
blows the ocean, warmed by the sun, so that water heaps
up in the western Pacific. At the same time, cold water
deep in the ocean is drawn eastwards, then wells up to
replace the westward travelling warm water, so creating
excellent fishing grounds. Thus, the normal situation
is warm water (about 30°C) in the west, and cooler
water (about 22°C) in the east.
During an El Niño period, the east-to-west winds
become weaker, so less warm water is blown west and less
colder water is drawn eastwards. This results in the eastern
Pacific water being warmer, a characteristic of El Niño.
Further, the warmer eastern ocean has the effect of weakening
the westbound winds, which compounds this effect in a
weak positive
feedback loop.
The usual upwelling of cold, nutrient-rich water near
South American coasts does not occur. The resulting warmer
water temperature is associated with widespread weather
perturbations in the area. This includes disturbing the
route of the Pacific Jet Stream, and the death of fish
and plankton.
Strong El Niños last about a year, resulting in
wet winters in southwest Americas and droughts in Australia
and Indonesia. El Niños occur roughly even three
to seven years, but there is no set periodicity or strength.
La Niña is the cool current counterpart to El
Niño, when a significant cooling of ocean currents
occur. It occurs less frequently than El Niño.There
is cooler water in the west and warmer water in the eastern
Pacific. In this case, there will be unusually wet weather
in Australasia and drought in the western equatorial Americas.
The names El Niño and La Niña come from
the Spanish, meaning boy child and girl child. El Niño
was so named because warm ocean currents would appear
off Peru around Christmas time when ‘El Niño’,
Jesus, was born.
related material
the
melting of glaciers
global
warming
Arctic
melting ice, sea levels  |