|
|
|
|
|
|
||
|
|
|
|
|
anthropogenic
global warming,
|
|
|||
|
|
|
|||
| on energy | on global warming | |||
| sustainable futures briefing documents |
Tectonics: tectonic plates - floating on the surface of a cauldron |
|||
|
|
butterfly wingsHumans love patterns. They seek to simplify the world, which allows them to manage without doing too much thinking or counting. Their simple machines are manufactured to go round and round and round on fixed tracks, like the motor in a car. Humans have tried to apply simple models to the universe in order to simplify, thus the sun goes around the Earth in 365 days. But, of course, it doesn’t, it goes around the sun in 365¼ days and a little bit, and a little bit of that. And then, of course, that timing varies ever so slightly over the millennia; and that little bit of variation starts to mount up over a billion years. Then, as humans learn more, they learn about variations within variations, as you will see in the Milankovitch cycles section. They look at a few ice ages and think maybe the Milankovitch cycles caused them, so for a century or two they struggle valiantly to make these two things fit together. Every time, a bit more information makes the fit not quite so tidy. Month by month and year by year, our understanding of ice age data increases. The more data we gather, the more untidy the real world looks. Very small changes in the path of a Mars shot will expand to millions of miles by the time rocket reaches its destination. Very tiny (accidental) differences to where a seed falls in a forest can determine whether the seed becomes a 200-foot giant, or is eaten by a squirrel. Small differences can determine whether a species survives and thrives, or is never heard of again. Small changes can determine whether a tornado gathers and accumulates, finding a path to New Orleans, or whether it peters out in mid-ocean, or takes a slightly different route to a less annoying landfall. Neither do we know much at all what starts or stops an ‘ice age’. Very possibly some trivial or accidental process goes into positive feedback, this leaves plenty of work for the future. We still struggle to forecast weather a few days ahead, let alone understand a world of hundreds of thousands of years ago - or billions of years - from a few ice or sediment core samples. This is the real world, and the real world of advancing modern science. It is not a world of certainties or a few easy patterns. But despite all these uncertainties, we do expect the sun to rise in the morning and we do believe that we have a reasonable grasp on anthropogenic global warming. Do not become confused between areas of knowledge where we are not completely blind and areas where much that is written is bordering on hubris and speculation. Human knowledge comes on a scale of knowing rather a lot about rather a little, to knowing very little about rather a lot. It is sane to keep constant awareness of whether you are in the shallow end of a heated swimming pool, or in the middle of the North Atlantic during a raging storm. flat earthersFlat earthers make up all sorts of speculative reasons why “there is no anthropomorphic global warming” [AGW]. Many of these ‘reasons’ are based on poorly grasped comments from sloppy fossil media and web sources. The purpose of this subsidiary briefing document is to provide the means for you to follow up these specious claims in more detail, should you wish. There is a great mass of discussion in books and appropriate journals, and increasingly upon the Net. In a sense, this subsidiary document is a review of the elements that are not primarily emphasised as being relevant to modern anthropogenic global warming concerns! There is most definitely anthropogenic warming.
But we still do not know many of the details. While the consensus is strongly that AGW is a reality, it should be kept in mind that a limited amount of global warming may prove to be a net benefit. So, moonbats write all sorts of nonsense attempting to
‘be different’ and suggest all manner of mechanisms
whereby AGW is not happening, Here is an example from the Cato Institute, which is often dubiously supported by all sorts of industrial interests that would rather not change (or pay for) their filthy externalisation of costs. But there is still that awkward problem - reality!! There is real global warming with considerable empiric evidence - the world is getting hotter. So the moonbats must make all manner of claims that it is really about the sun’s output changing or 101 other excuse-me’s. Now, every adequate scientist knows full well that, with complicated systems, establishing causal links is no cake-walk. But when sane scientists see two phenomena tracking each other, they tend to try to work out if there is a linkage. Meanwhile special interests, for instance the cigarette industry, struggle for decades to dismiss the ever-growing links between illnesses and tobacco. Or the media industry tries to deny a link between violence on film and violence in the playground. Or the filthy fossil fuel companies struggle to dismiss any links between their filth and global warming. But, back to that pesky reality again. The filth also kills millions right now. Meanwhile, the West is increasingly dependent on a backward area of the world for energy, an area which is also a source of considerable current aggravation. Among other lies spread by the nay-sayers is the claim that global warming scientists claim more than they know. This is a good way to pretend that there really is ‘no problem’. But, in fact, serious
climate scientists make no such claims. the case against the accusedIt has taken decades to bring responsibility home to the tobacco drug pushers, and it ain’t over yet. We have still a way to go before bringing responsibility home to the media corporations. How long before sufficient causal evidence is deemed enough to force responsibility on the filthy dangerous fossil fuel industry? Meanwhile, back in the real world again, planetary temperatures
are rising. But of course, we can’t really be certainly sure, can we? Maybe it’s all to do with university grants, or mickey mouse! |
“The most prevalent reasonably scientific question
about current climate changes is ‘how do we know
that this isn’t natural variability?’.
|
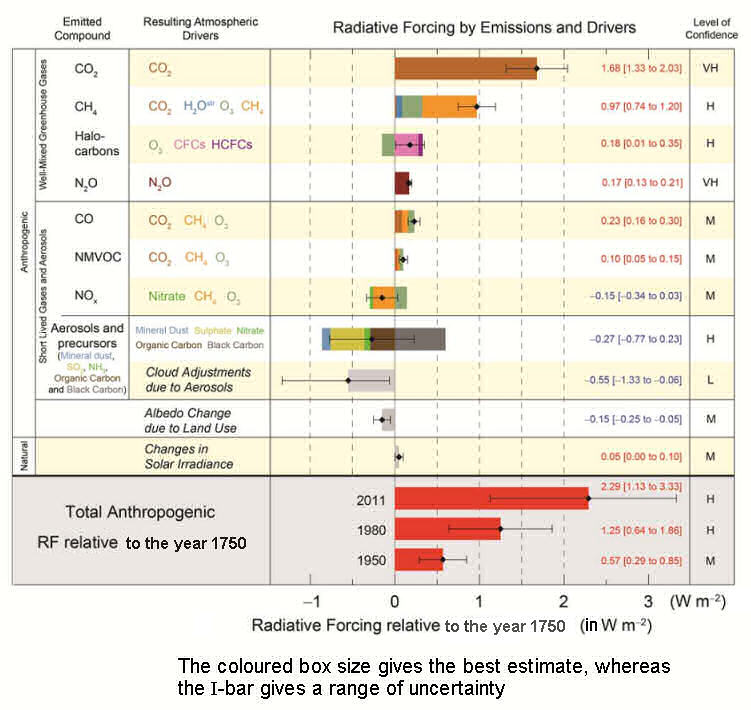
pressing reasons for actionThere are other pressing reasons for controlling fossil fuel filth. There are pressing reasons for reducing dependence. The probability/consensus is that the greenhouse gases are highly relevant. And we have a batch of better alternatives. Why not just get on with improving the situation? Unless, of course, you are involved in the filthy fossil fuel industry. The arguments for greenhouse gases are far from ‘weak’. They are the most understood effects by a long march. Perhaps doubters are confusing the level of knowledge of GHG warming contributed to heavily by human activities, with the smaller uncertainties elsewhere. ice
and sediment cores
|
February
2007 UN IPCC report 4, part 1 - links
|
advertising disclaimer |
medieval warming, the atlantic conveyor and “the maunder minimum”For longer term effects, see past ice ages and interglacials. The Atlantic Conveyor (AC), the Gulf Stream, the meridional overturning circulation (MOC), North Atlantic thermohaline circulation (THC), and I believe some other fancy names, all apply to the same thing, one of the great ocean currents of the world. This current transports water from the Caribbean northwards to the Arctic ice. From the surface waters evaporation occurs. Thus, the water increases in salinity and, therefore in density. On freezing to Arctic ice, this leaves the remaining water even more salty and, therefore, more dense, and also colder. Consequently, the cold water sinks, thus drawing up more water from the south to replace the water that sank. This process acts like a giant conveyor belt, and is known as an overturning current. When it reaches the south of its journey, the water coming down from the north warms and rises. This rising water is known as an up-welling current. The up-welling current carries nutrients and is one of the processes by which fisheries and productivity are driven around the world’s oceans.
If the Atlantic Conveyor were to stop, Northern Europe would become, locally, considerably colder. The planet would not become colder (unless this resulted in the spread of ice fields and, therefore, an increased albedo), but the distribution of heat would change; probably with effects upon ocean productivity. There are fears that global warming could, in fact, slow or shut down the Atlantic Conveyor. See also ocean acidity.
As you can see from the graph above,
temperatures have slowly trended downward since the end
of the last glaciation (ice age).
A few decades ago, when we knew less, there were growing
fears of a new expansion of glaciation. It is possible
that we may eventually, as we understand more, start to
believe that at least a little global warming has come
at just the right time!
Let us now telescope in on the last thousand years of the first graph above (Holocene temperature variations), shown in this graph. Understand that what you are seeing is the downward global trend for the past thousand years, followed by a rather violent reversal of that trend. Meanwhile, one of the real world facts impressing itself on climate science is that, while global climate varies over different periods, the recent variation is both rapid and associated with a well-known probable cause. Note also that the slowing and reversal of the cooling trend corresponds with the growing use of fossil fuels. The warmer, medieval period and the so-called ‘maunder minimum’ (or, ‘Little Ice Age’) in Europe are regarded as a local and relatively minor effects, related to the Atlantic Conveyor and sun variation.
Alongside this
rather speculative linked article from NASA is a useful
animation showing this effect (Animation
of World - 2.2 MB MPEG). explanatory notes on global temperature variation graphsOn the graphs just above, the various lines are the results of various different workers’ estimates. In such circumstances, one option is to average out the lot. The heavy black lines are such an averaging. To follow the arguments well, really it is necessary to study statistics. Statistics is one of the most difficult studies of the human mind and is often poorly understood even by statisticians. Intelligence: misuse and abuse of statistics may help that unserstanding.. In statistics there is a phrase, ‘the law of large numbers’ this tends to mean that ‘errors’ will (may!) get lost in large data bases. That is, random errors ‘cancel out’. One way of dealing with the problems where trends are uncertain is to do what is called a moving average. A moving average is deemed to iron out errors/variations. It is particularly useful if you have a regular variation, like with the 12 months of the year where seasons effect your data, for instance when looking at monthly sales in a shop. So in summary, there are various ways and reasons to ‘smooth’ out data, as in cases of regularly varing data subject to ‘random’ perturbation. An apposite example is years of temperature data using different worker estimates. Note that ‘random’ is a word that needs much caution! The point of leaving in the original time series (in those graphs) is to allow more able readers of data to have an idea of how uncertain the data is. Much of the weather data series are estimates based on ‘surrogates’, like tree ring data or ice core analysis. These are surrogates for temperature readings from ‘thermometers’. Otherwise to say, ‘it’ gets complicated. The NASA animation linked above is of a local effect, that is in the North Atlantic and probably driven by the Atlantic Conveyor. It is vital to clarify the difference between global warming and local weather variations. Some ‘local’ weather variation have very large effects, for instance La Nina and Le Nino. The Nina effects switch quite often. The Atlantic Conveyor is much more stable, but is also capable of switching. ‘Global warming’ is just what it says on the packet. Global, a global average, and with the word ‘average’ we are back to statistics! And that is severe hard work and a lot of experience of reading numbers.
cloud effects
To be developed.
on paleoclimateIn this section, I will focus on the very long-term. You are liable to read about or hear people confusing the anthropomorphic global warming situation by reference to one or another of these long-term changes - atmospheric carbon dioxide, Milankovitch cycles, tectonic plates. One of the most pressing arguments in favour of the AGW analysis is that the change in global warming is happening so rapidly, and particularly the changes in greenhouses gases. When this is pointed out, rather feeble references will often be made to positive feedback, which may hint at some weak plausibility. Meanwhile, we have the much more immediate and obvious link between greenhouse gases and actual warming. Blue-sky speculation on rather unconvincing ‘theories’ is, naturally, increasingly being discounted by the general scientific consensus. atmospheric CO2Excerpt from a excellent page on this subject, with several graphs, and from a site that looks interesting as well.
Milankovitch
cycles Keep in mind that Milanovitch cycles involve season changes due to the state of the Earth in its journey around the sun. They do not involve differences in the output energy of the sun. There are three main cycles brought about by eccentricities in the orbit of the Earth around the sun. These cycles last
These cycles have not been reliably linked to long-term climate. These differences are not thought to be great enough to do more than marginally alter the amount of energy reaching the earth from the sun. To claim any effect on earth climate, it is necessary to suggest feedback mechanisms such as, for instance, albedo changes from marginally extra snow fall. Ellipsicity effects the differences of heat distribution between summer and winter. These differences range from around 6% at one part of the cycle to maybe 25% during the most elliptical phases. We are currently near to the part of least variation in the 95,800 years’ cycle. That is, the least variation between winter and summer. Axial tilt is currently about half way between its extremes of its 41,000 year cycle. This effects the contrast between the severity of seasons. The part of the theory concerning axial tilt suggests that less tilt may increase snow cover. Precession is the wobble that can be seen with a spinning gyroscope or top. This 21,700 year cycle moves the winter and summer peaks closer to or further from equilibrium. We are currently in the equilibrium part of the cycle. Vostok tells us a story of mostly glaciation for the last 400,000 years, with short interglacial periods of up to 20,000 years, very roughly every 100,000 years. (This is part of the reason so many have tried to fit the Milankovitch data to weather.) The recent interglacial period has already lasted around 10,000 years. There was a dip starting around 700 years ago which appears to have started to reverse at about 1800 AD. In other words, we do not know quite why the weather swings over the eons, but we do suspect that we are due to go into another ice-age at any time. This 100,000 years’ cycle has recently replaced a much shorter cycle, some claim that that earlier cycle was around 40,000 years. [Note that the Moon also wobbles in its orbit, affecting the height of tides.]
tectonic platesThe Earth is about 4.6 billion years old. Again, our knowledge of its history has been growing at a rapid and increasing rate for the last couple of hundred years. During that 4.6 billion years, the land areas of the Earth have moved around quite a bit, sometimes pushing land masses to a greater altitude, sometimes to the poles. Naturally, in these latter conditions snow can fall and accumulate, increasing the planetary albedo and generating positive feedback. As the plates move around, the major currents of the ocean vary. These currents, like El-niño and the Atlantic Conveyor, transfer heat around and, consequently, strongly affect local climates. In the days of Pangea, obviously ocean currents were less complex. Presently two-thirds of global land mass is in the northern hemisphere and, therefore, variations in albedo are expected vary more in the northern hemisphere, thus the northern hemisphere is expected to dominate insolation-driven climate.
variation in sun energy outputThis is little understood as yet, as we have only just started going out into space, and developing sufficiently theory. A minor, eleven-year cycle, which changes the out put of the sun, has been identified in recent times, though it is unlikely to be a long-term trend. However, the difference in energy output is very small compared to the forcing theorised for greenhouse gases, and sun variation is not considered to be a major factor in climate change. Incidentally, the core of the Earth is also heated by nuclear processes and, while these do contribute to planetary conditions, they are not expected to vary in a relevant manner. To be developed.
variation in sun energy outputThis is little understood as yet, as we have only just started going out into space, and developing sufficiently theory. A minor, eleven-year cycle, which changes the out put of the sun, has been identified in recent times, though it is unlikely to be a long-term trend. However, the difference in energy output is very small compared to the forcing theorised for greenhouse gases, and sun variation is not considered to be a major factor in climate change. Incidentally, the core of the Earth is also heated by nuclear processes and, while these do contribute to planetary conditions, they are not expected to vary in a relevant manner. On very large timescales, the sun and the Earth are estimated to be about four and a half million years old, and the sun’s output is increasing approximately 10% every billion years. In a mere billion years, it is estimated that the Earth will become too hot for liquid water, this may be inconvenient should you live that long. In about five billion years, the sun will move out of main sequence evolution into a red giant phase.
ocean acidity[Abstracted from currents.ucsc.edu]
The Paleocene-Eocene Thermal Maximum (PETM) was a period of extreme global warming, when temperatures rose by as much as 10 degrees in a relatively short time period. Sediment cores drilled out of ocean floors show an sharp change in ocean chemistry when the PETM began 55 million years ago. The following chemistry recovery took at least 80,000 years.
Note, these models etc. do not include any feedback allowances. bibliography and brief reviews—
end notes
|
||||||||||||
© abelard, 2007,1 february the address for this document is https://www.abelard.org/briefings/anthropogenic_global_warming.php 6450 words |
| latest | abstracts | briefings | information | headlines | resources | interesting | about abelard |